modelicares.util
Classes and functions to help plot and interpret experimental data
Classes:
- ArrowLine - A matplotlib subclass to draw an arrowhead on a line
- CallList - List that when called returns a list of the results from calling its elements
Functions:
- add_arrows() - Overlay arrows with annotations on top of a pre-plotted line.
- add_hlines() - Add horizontal lines to a set of axes with optional labels.
- add_vlines() - Add vertical lines to a set of axes with optional labels.
- basename() - Return the base filename from fname.
- cast_sametype() - Decorate a method to return an instance of the containing class.
- color() - Plot 2D scalar data on a color axis in 2D Cartesian coordinates.
- closeall() - Close all open figures (shortcut to the destroy_all() from matplotlib._pylab_helpers.Gcf).
- delayed_exit() - Exit with a message and a delay.
- expand_path() - Expand a file path by replacing ‘~’ with the user directory and make the path absolute.
- flatten_dict() - Flatten a nested dictionary.
- flatten_list() - Flatten a nested list.
- figure() - Create a figure and set its label.
- get_indices() - Return the pair of indices that bound a target value in a monotonically increasing vector.
- get_pow1000() - Return the exponent of 1000 for which the significand of a number is within the range [1, 1000).
- load_csv() - Load a CSV file into a dictionary.
- match() - Reduce a list of strings to those that match a pattern.
- multiglob() - Return a set of filenames that match sets of pathnames and extensions.
- plot() - Plot 1D scalar data as points and/or line segments in 2D Cartesian coordinates.
- quiver() - Plot 2D vector data as arrows in 2D Cartesian coordinates.
- replace() - Perform a list of replacements on the text in a list of files.
- save() - Save the current figures as images in a format or list of formats.
- saveall() - Save all open figures as images in a format or list of formats.
- setup_subplots() - Create an array of subplots and return their axes.
- shift_scale_x() - Apply an offset and a factor as necessary to the x axis.
- shift_scale_y() - Apply an offset and a factor as necessary to the y axis.
- si_prefix() - Return the SI prefix for a power of 1000.
- tree() - Return a tree of strings as a nested dictionary.
- yes() - Ask a yes/no question and return True if the answer is ‘Y’ or ‘y’.
- class modelicares.util.CallList
List that when called returns a list of the results from calling its elements.
Example:
>>> f = lambda x: lambda y: x*y
>>> l = CallList([f(2), f(3)])
>>> l(5)
[10, 15]
- __call__(*args, **kwargs)
Return a list of the results from calling the elements of the list.
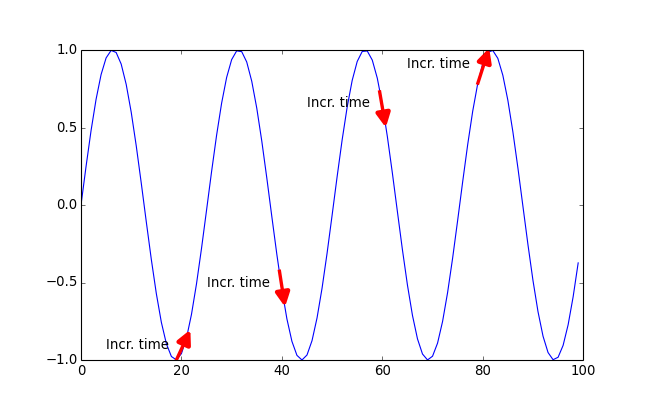
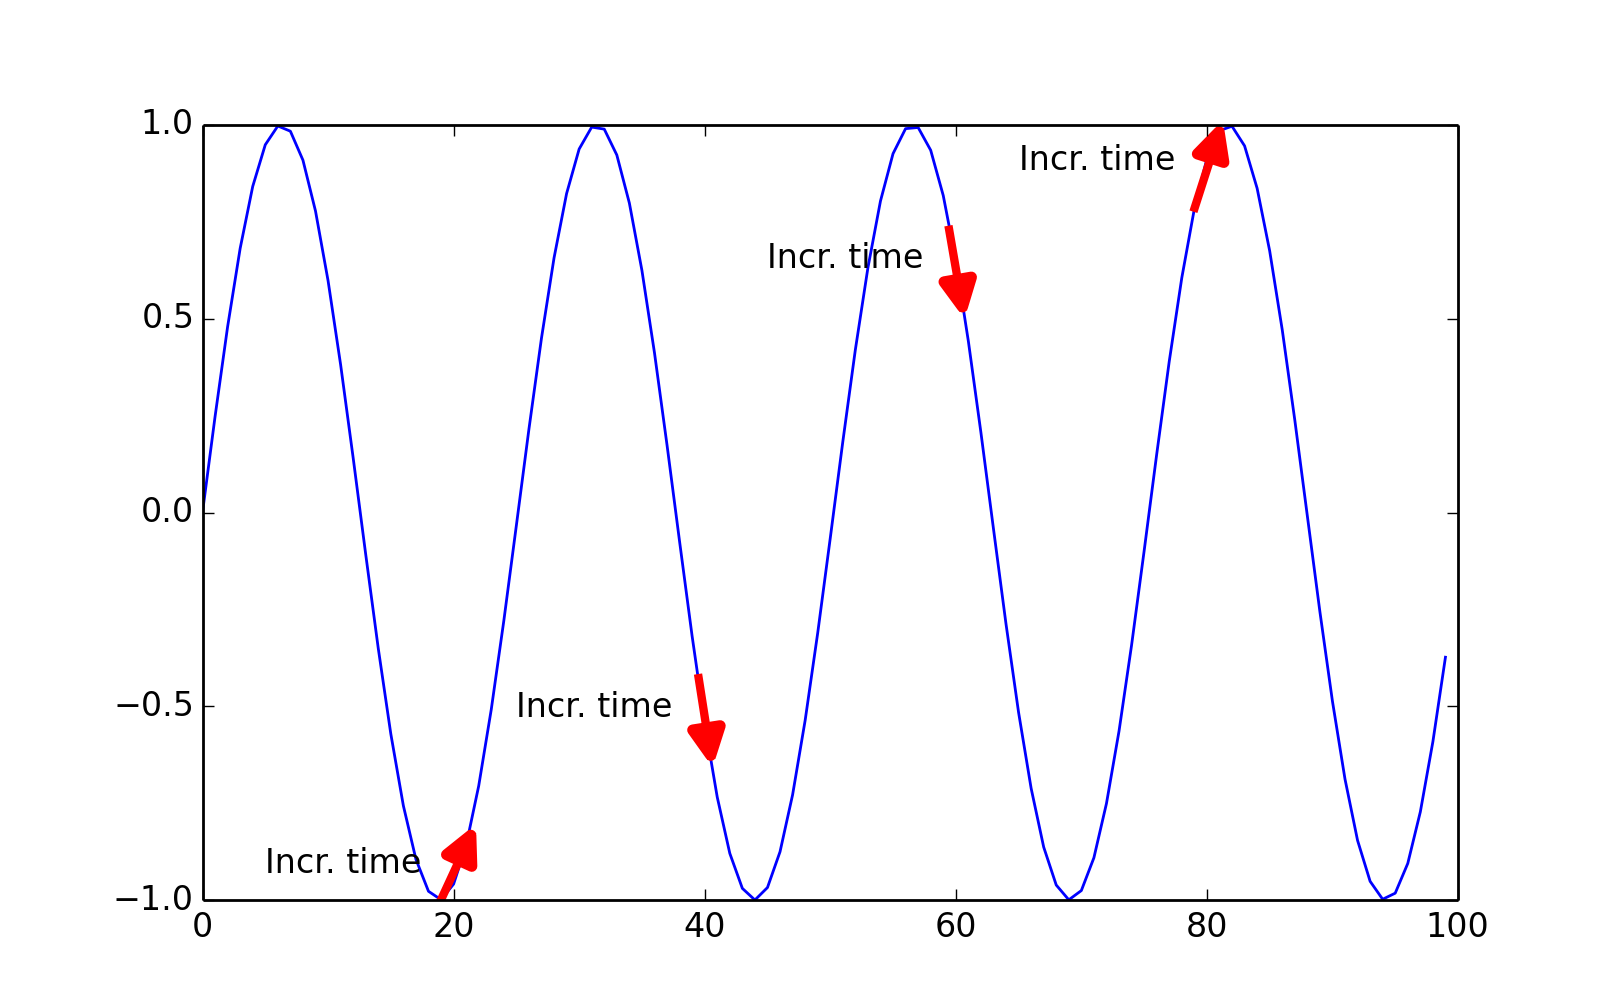
- modelicares.util.add_arrows(plot, x_locs=[0], xstar_offset=0, ystar_offset=0, lstar=0.05, label='', orientation='tangent', color='r')
Overlay arrows with annotations on a pre-plotted line.
Arguments:
- plot: A plot instance (matplotlib.lines.Line2D object)
- x_locs: x-axis locations of the arrows
- xstar_offset: Normalized x-axis offset from the middle of the arrow to the text
- ystar_offset: Normalized y-axis offset from the middle of the arrow to the text
- lstar: Length of each arrow in normalized xy axes
- label: Annotation text
- orientation: ‘tangent’, ‘horizontal’, or ‘vertical’
- color: Color of the arrows (from matplotlib.colors)
Example:
(Source code, png, hires.png, pdf)

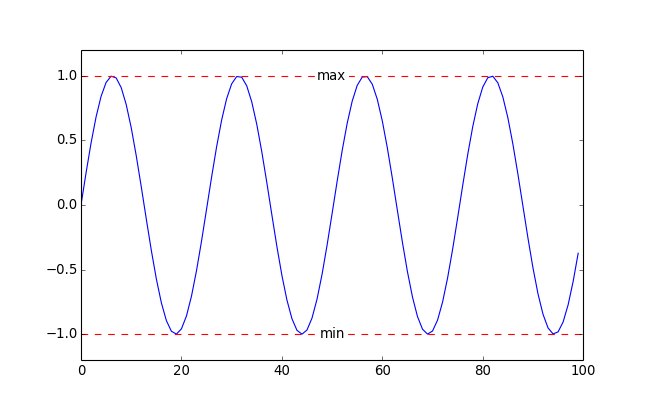
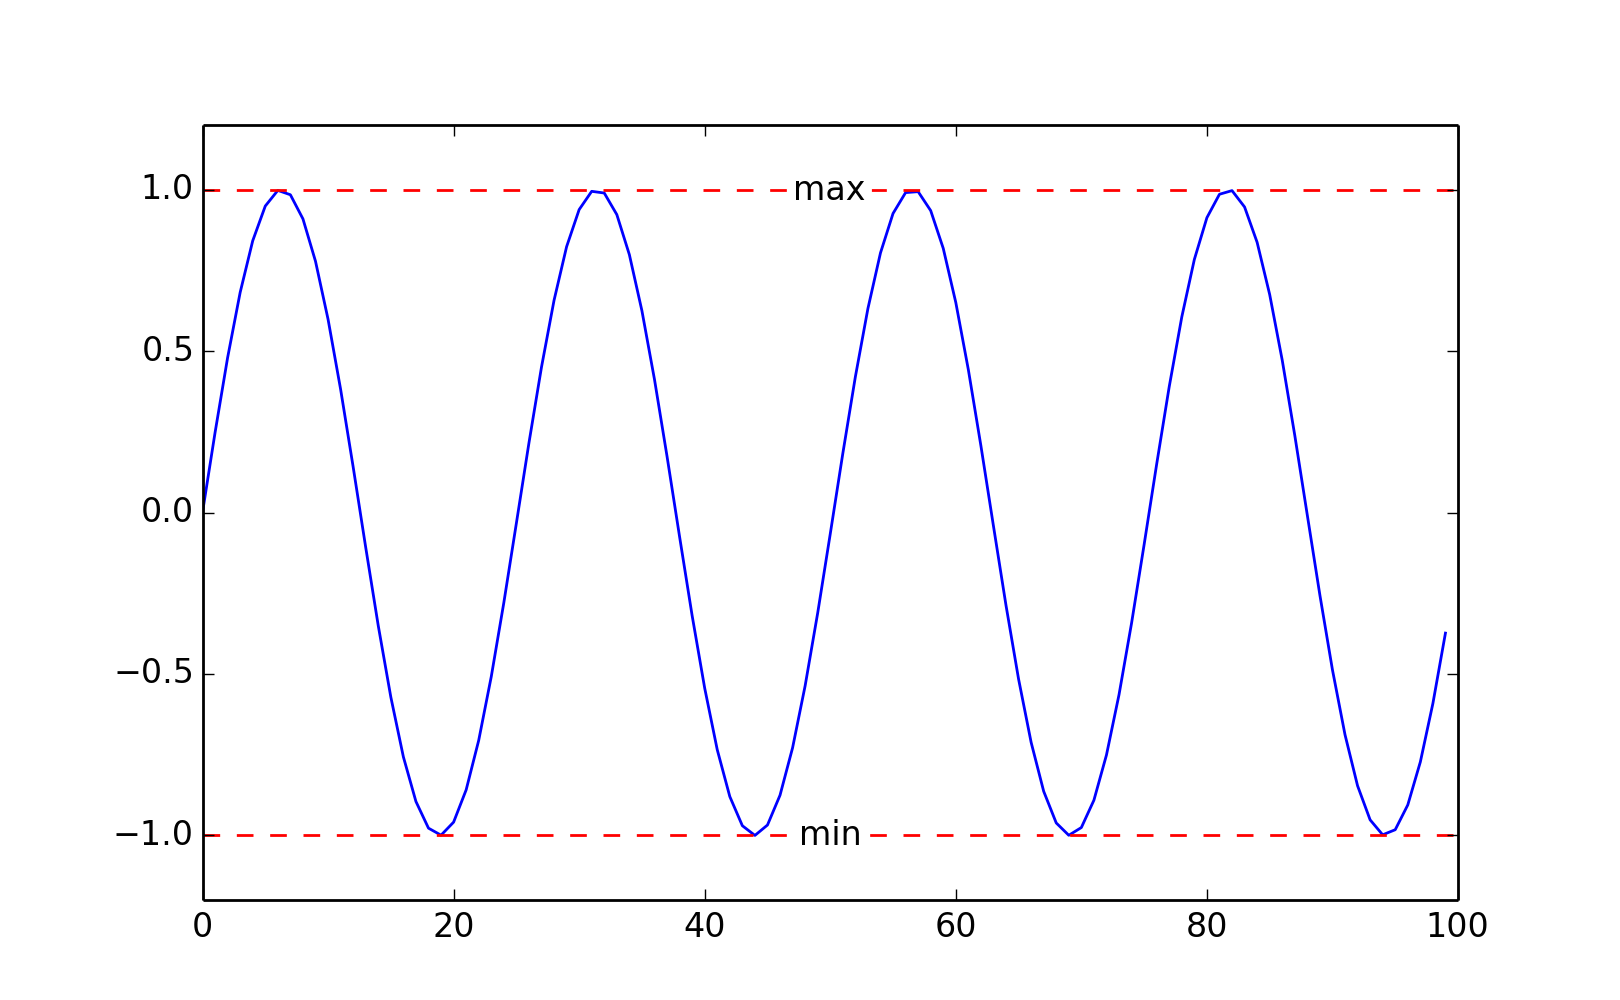
- modelicares.util.add_hlines(ax=None, positions=[0], labels=[], **kwargs)
Add horizontal lines to a set of axes with optional labels.
Arguments:
ax: Axes (matplotlib.axes.Axes object)
positions: Positions (along the x axis)
labels: List of labels for the lines
**kwargs: Line properties (propagated to matplotlib.pyplot.axhline())
E.g., color='k', linestyle='--', linewidth=0.5
Example:
(Source code, png, hires.png, pdf)
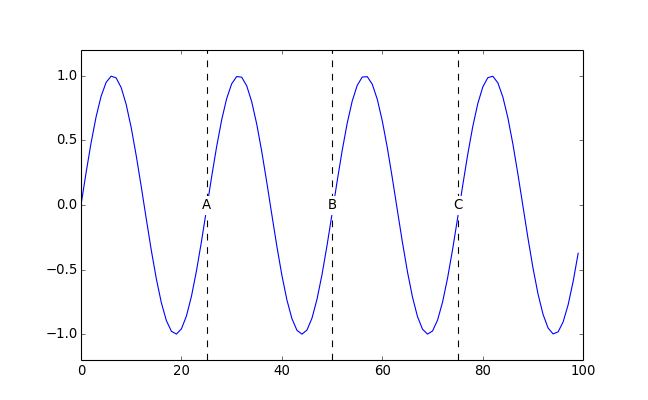
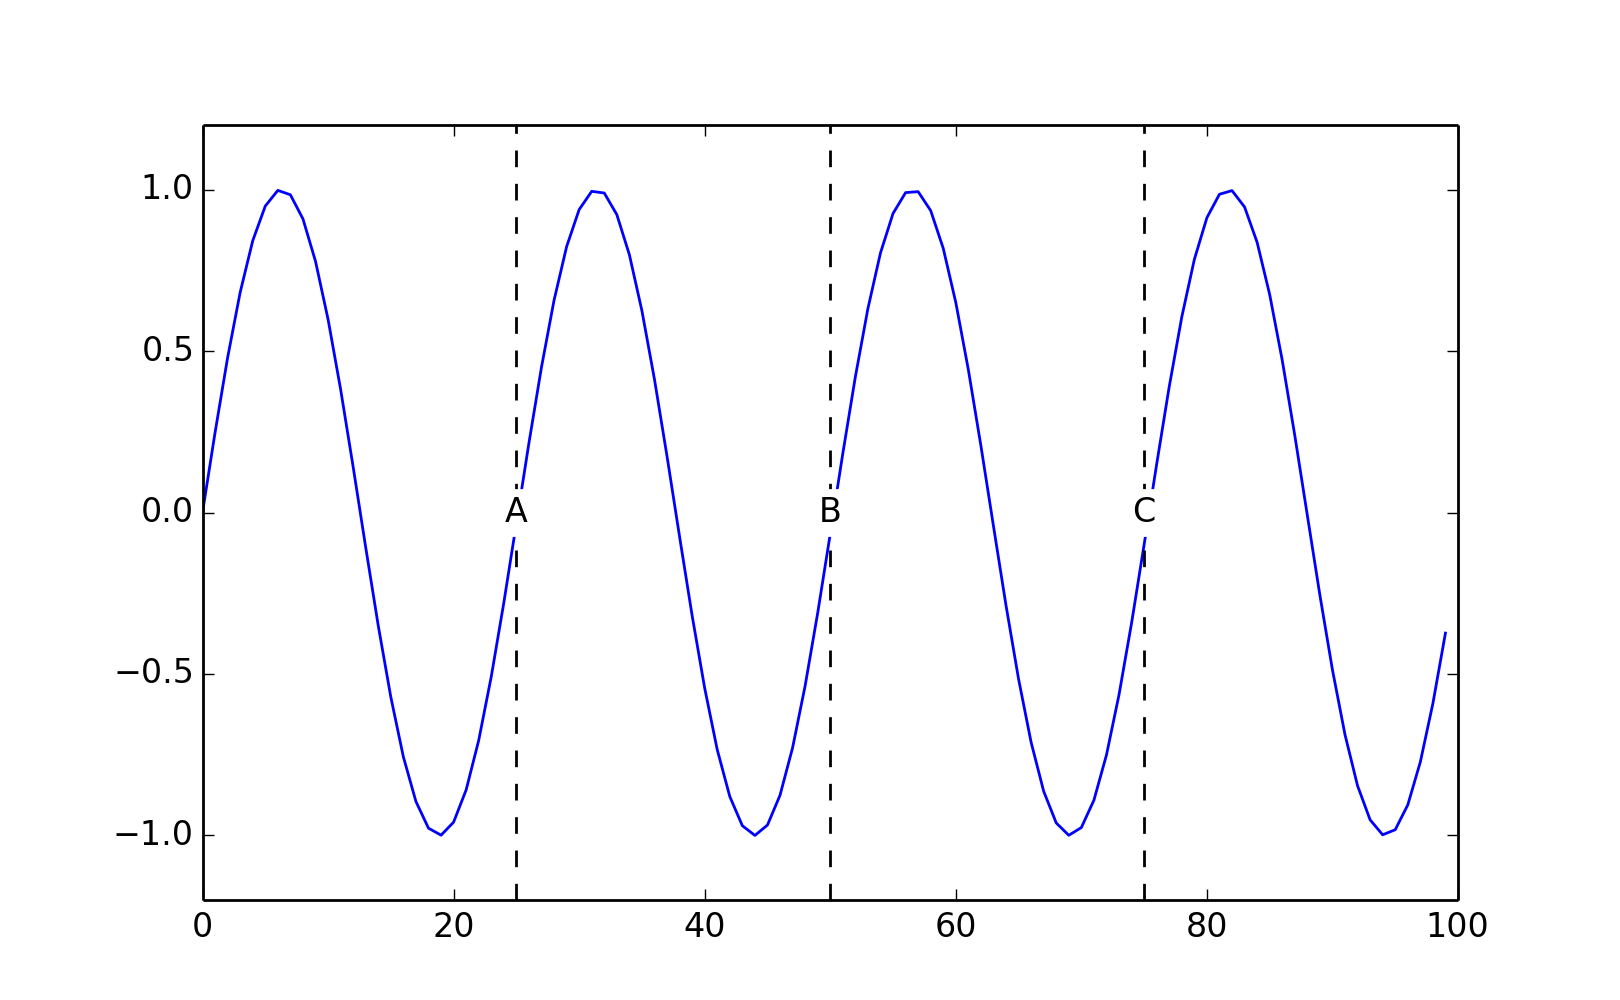
- modelicares.util.add_vlines(ax=None, positions=[0], labels=[], **kwargs)
Add vertical lines to a set of axes with optional labels.
Arguments:
ax: Axes (matplotlib.axes.Axes object)
positions: Positions (along the x axis)
labels: List of labels for the lines
**kwargs: Line properties (propagated to matplotlib.pyplot.axvline())
E.g., color='k', linestyle='--', linewidth=0.5
Example:
(Source code, png, hires.png, pdf)
- modelicares.util.basename(fname)
Return the base filename from fname.
Unlike os.path.basename(), this function strips the file extension.
- modelicares.util.cast_sametype(meth)
Decorate a method to return an instance of the containing class.
- modelicares.util.color(ax, c, *args, **kwargs)
Plot 2D scalar data on a color axis in 2D Cartesian coordinates.
This uses a uniform grid.
Arguments:
- ax: Axis onto which the data should be plotted
- c: color- or c-axis data (2D array)
- *args, **kwargs: Additional arguments for matplotlib.pyplot.imshow()
Example:
>>> import numpy as np
>>> import matplotlib.pyplot as plt

>>> x, y = np.meshgrid(np.arange(0, 2*np.pi, 0.2),
...                    np.arange(0, 2*np.pi, 0.2))
>>> c = np.cos(x) + np.sin(y)

>>> fig = plt.figure()
>>> ax = fig.add_subplot(111)
>>> color(ax, c)
<matplotlib.image.AxesImage object at 0x...>
- modelicares.util.delayed_exit(message='Exiting...', t=0.5)
Exit with a message (message) and a delay of t seconds.
Example:
>>> delayed_exit()
Exiting...
- modelicares.util.expand_path(path)
Expand a file path by replacing ‘~’ with the user directory and making the path absolute.
Example:
>>> expand_path('~/Documents')
'...Documents'
where ... is ‘/home/user/’ on Linux or ‘C:Usersuser’ on Windows (and “user” is the user id).
- modelicares.util.figure(label='', *args, **kwargs)
Create a figure and set its label.
Arguments:
- label: String to apply to the figure’s label property
- *args, **kwargs: Additional arguments for matplotlib.pyplot.figure()
Example:
>>> import matplotlib.pyplot as plt

>>> fig = figure("velocity_vs_time")
>>> plt.getp(fig, 'label')
'velocity_vs_time'
- modelicares.util.flatten_dict(d, parent_key='', separator='.')
Flatten a nested dictionary.
Arguments:
- d: Dictionary (may be nested to an arbitrary depth)
- parent_key: Key of the parent dictionary, if any
- separator: String or character that joins elements of the keys or path names
Example:
>>> flatten_dict(dict(a=1, b=dict(c=2, d='hello')))
{'a': 1, 'b.c': 2, 'b.d': 'hello'}
- modelicares.util.flatten_list(l, ltypes=(<type 'list'>, <type 'tuple'>))
Flatten a nested list.
Arguments:
l: List (may be nested to an arbitrary depth)
If the type of l is not in ltypes, then it is placed in a list.
ltypes: Tuple (not list) of accepted indexable types
Example:
>>> flatten_list([1, [2, 3, [4]]])
[1, 2, 3, 4]
- modelicares.util.getSaveFileName(*args, **kwargs)
- modelicares.util.get_indices(x, target)
Return the pair of indices that bound a target value in a monotonically increasing vector.
Arguments:
- x: Vector
- target: Target value
Example:
>>> get_indices([0, 1, 2], 1.6)
(1, 2)
- modelicares.util.get_pow1000(num)
Return the exponent of 1000 for which the significand of a number is within the range [1, 1000).
Example:
>>> get_pow1000(1e5)
1
- modelicares.util.load_csv(fname, header_row=0, first_data_row=None, types=None, **kwargs)
Load a CSV file into a dictionary.
The strings from the header row are used as dictionary keys.
Arguments:
fname: Path and name of the file
header_row: Row that contains the keys (uses zero-based indexing)
first_data_row: First row of data (uses zero-based indexing)
If first_data_row is not provided, then it is assumed that the data starts just after the header row.
types: List of data types for each column
int and float data types will be cast into a numpy.array. If types is not provided, attempts will be made to cast each column into int, float, and str (in that order).
**kwargs: Additional arguments for csv.reader()
Example:
>>> data = load_csv("examples/load-csv.csv", header_row=2)
>>> print("The keys are: %s" % list(data))
The keys are: ['Description', 'Make', 'Model', 'Price', 'Year']
- modelicares.util.match(strings, pattern=None, re=False)
Reduce a list of strings to those that match a pattern.
By default, all of the strings are returned.
Arguments:
strings: List of strings
pattern: Case-sensitive string used for matching
If re is False (next argument), then the pattern follows the Unix shell style:
Character(s) Role * Matches everything ? Matches any single character [seq] Matches any character in seq [!seq] Matches any char not in seq Wildcard characters (‘*’) are not automatically added at the beginning or the end of the pattern. For example, ‘*x*’ matches all strings that contain “x”, but ‘x*’ matches only the strings that begin with “x”.
If re is True, regular expressions are used a la Python’s re module. See also http://docs.python.org/2/howto/regex.html#regex-howto.
Since re.search() is used to produce the matches, it is as if wildcards (‘.*’) are automatically added at the beginning and the end. For example, ‘x’ matches all strings that contain “x”. Use ‘^x$’ to match only the strings that begin with “x” and ‘x$’ to match only the strings that end with “x”.
Note that ‘.’ is a subclass separator in Modelica but a wildcard in regular expressions. Escape the subclass separator as ‘\.’.
re: True to use regular expressions (False to use shell style)
Example:
>>> match(['apple', 'orange', 'banana'], '*e')
['apple', 'orange']
- modelicares.util.multiglob(pathnames, extensions=set(['*.mat']))
Return a set of filenames that match a pathname pattern.
Unlike Python’s glob.glob() function, this function runs an additional expansion on matches that are directories.
Arguments:
pathnames: String or set of strings used to match files or folders
This may contain Unix shell-style patterns:
Character(s) Role * Matches everything ? Matches any single character [seq] Matches any character in seq [!seq] Matches any char not in seq
extensions: Filename pattern or set of patterns that should be used to match files in any directories generated from pathnames
These may also use the shell-style patterns above.
Example:
>>> multiglob("examples/ChuaCircuit/*/")
['examples/ChuaCircuit/1/dsres.mat', 'examples/ChuaCircuit/2/dsres.mat']
- modelicares.util.plot(y, x=None, ax=None, label=None, color=['b', 'g', 'r', 'c', 'm', 'y', 'k'], marker=None, dashes=[(None, None), (3, 3), (1, 1), (3, 2, 1, 2)], **kwargs)
Plot 1D scalar data as points and/or line segments in 2D Cartesian coordinates.
This is similar to matplotlib.pyplot.plot() (and actually calls that function) but provides direct support for plotting an arbitrary number of curves.
Arguments:
y: List of y-axis series
x: x-axis data
If x is not provided, the y-axis series will be plotted versus its indices. If x is a single series, it will be used for all of the y-axis series. If it is a list of series, each x-axis series will be matched to a y-axis series.
ax: Axis onto which the data should be plotted.
If ax is None (default), axes are created.
label: List of labels of each series (to be used later for the legend if applied)
color: Single entry, list, or itertools.cycle() of colors that will be used sequentially
Each entry may be a character, grayscale, or rgb value.
marker: Single entry, list, or itertools.cycle() of markers that will be used sequentially
Use None for no marker. A good assortment is [‘o’, ‘v’, ‘^’, ‘<’, ‘>’, ‘s’, ‘p’, ‘*’, ‘h’, ‘H’, ‘D’, ‘d’]. All of the possible entries are listed at: http://matplotlib.sourceforge.net/api/artist_api.html#matplotlib.lines.Line2D.set_marker.
dashes: Single entry, list, or itertools.cycle() of dash styles that will be used sequentially
Each style is a tuple of on/off lengths representing dashes. Use (0, 1) for no line and (None, None) for a solid line.
**kwargs: Additional arguments for matplotlib.pyplot.plot()
Returns: List of matplotlib.lines.Line2D objects
Example:
>>> plot([range(11), range(10, -1, -1)])
[[<matplotlib.lines.Line2D object at 0x...>], [<matplotlib.lines.Line2D object at 0x...>]]
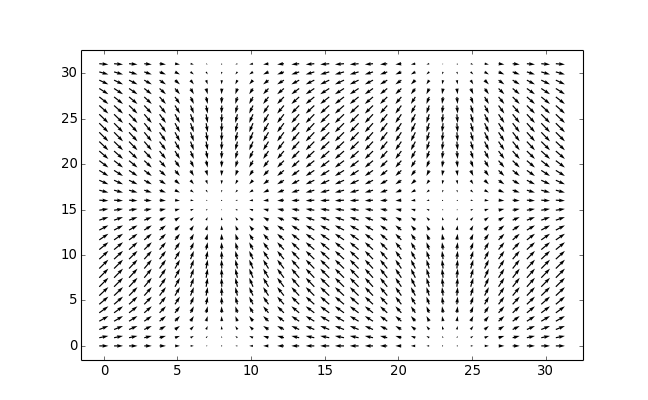
- modelicares.util.quiver(ax, u, v, x=None, y=None, pad=0.05, pivot='middle', **kwargs)
Plot 2D vector data as arrows in 2D Cartesian coordinates using a uniform grid.
Arguments:
- ax: Axis onto which the data should be plotted
- u: x-direction values (2D array)
- v: y-direction values (2D array)
- pad: Amount of white space around the data (relative to the span of the field)
- pivot: ‘tail’ | ‘middle’ | ‘tip’ (see matplotlib.pyplot.quiver())
- **kwargs: Additional arguments for matplotlib.pyplot.quiver()
Example:
(Source code, png, hires.png, pdf)

- modelicares.util.replace(fnames, rpls)
Perform a list of replacements on the text in a list of files.
Arguments:
fnames: Filename or list of filenames
rpl: List of replacements to make
Each entry is a tuple of (src, dest), where dest is a string that will replace the src string. Each string can use Python’s :mod:re expressions; see https://docs.python.org/2/library/re.html for details.
Example:
>>> fname = 'temp.txt'
>>> with open(fname, 'w') as f:
...     __ = f.write("apple orange banana")
>>> replace([fname], [('ba(.*)', r'ba\1\1')])
>>> with open(fname, 'r') as f:
...     print(f.read())
apple orange banananana
- modelicares.util.save(formats=['pdf', 'png'], fname=None, fig=None)
Save a figure in an image format or list of formats.
The base filename (with directory if necessary but without extension) is determined in this order of priority:
- fname argument if it is not None
- the label property of the figure, if it is not empty
- the response from a file dialog
A forward slash (;/’) can be used as a path separator, even if the operating system is Windows. Folders are created as needed.
Arguments:
formats: Format or list of formats in which the figure should be saved
fname: Filename (see above)
fig: matplotlib figure or list of figures to be saved
If fig is None (default), then the current figure will be saved.
Note
In general, save() should be called before matplotlib.pyplot.show() so that the figure(s) are still present in memory.
Example:
>>> import matplotlib.pyplot as plt

>>> figure('examples/temp')
<matplotlib.figure.Figure object at 0x...>
>>> plt.plot(range(10))
[<matplotlib.lines.Line2D object at 0x...>]
>>> save()
Saved examples/temp.pdf
Saved examples/temp.png
Note
The figure() function can be used to directly create a figure with a label.
- modelicares.util.saveall(formats=['pdf', 'png'])
Save all open figures as images in a format or list of formats.
The directory and base filenames (without extension) are taken from the label property of the open figures. If a figure has an empty label, then a file dialog is opened to choose the filename. Note that the figure() function can be used to directly create a figure with a label.
Arguments:
- formats: Format or list of formats in which the figures should be saved
Note
In general, saveall() should be called before matplotlib.pyplot.show() so that the figure(s) are still present in memory.
Example:
>>> import matplotlib.pyplot as plt

>>> figure('examples/temp')
<matplotlib.figure.Figure object at 0x...>
>>> plt.plot(range(10))
[<matplotlib.lines.Line2D object at 0x...>]
>>> saveall()
Saved examples/temp.pdf
Saved examples/temp.png
- modelicares.util.setup_subplots(n_plots, n_rows, title='', subtitles=None, label='multiplot', xlabel='', xticklabels=None, xticks=None, ylabel='', yticklabels=None, yticks=None, ctype=None, clabel='', left=0.05, right=0.05, bottom=0.05, top=0.1, hspace=0.1, vspace=0.25, cbar=0.2, cbar_space=0.1, cbar_width=0.05)
Create an array of subplots and return their axes.
Arguments:
n_plots: Number of subplots
n_rows: Number of rows of subplots
title: Title for the figure
subtitles: List of subtitles (i.e., titles for each subplot) or None for no subtitles
label: Label for the figure
This will be used as a base filename if the figure is saved.
xlabel: Label for the x-axes (only shown for the subplots on the bottom row)
xticklabels: Labels for the x-axis ticks (only shown for the subplots on the bottom row)
If None, then the default is used.
xticks: Positions of the x-axis ticks
If None, then the default is used.
ylabel: Label for the y-axis (only shown for the subplots on the left column)
yticklabels: Labels for the y-axis ticks (only shown for the subplots on the left column)
If None, then the default is used.
yticks: Positions of the y-axis ticks
If None, then the default is used.
ctype: Type of colorbar (None, ‘vertical’, or ‘horizontal’)
clabel: Label for the color- or c-bar axis
left: Left margin
right: Right margin (ignored if cbar_orientation is ‘vertical’)
bottom: Bottom margin (ignored if cbar_orientation is ‘horizontal’)
top: Top margin
cbar: Margin reserved for the colorbar (right margin if cbar_orientation is ‘vertical’ and bottom margin if cbar_orientation is ‘horizontal’)
hspace: Horizontal space between columns of subplots
vspace: Vertical space between rows of subplots
cbar_space: Space between the subplot rectangles and the colorbar
If cbar is None, then this is ignored.
cbar_width: Width of the colorbar if vertical (or height if horizontal)
If cbar is None, then this is ignored.
Returns:
- List of subplot axes
- Colorbar axis (returned iff cbar is not None)
- Number of columns of subplots
Example:
(Source code, png, hires.png, pdf)
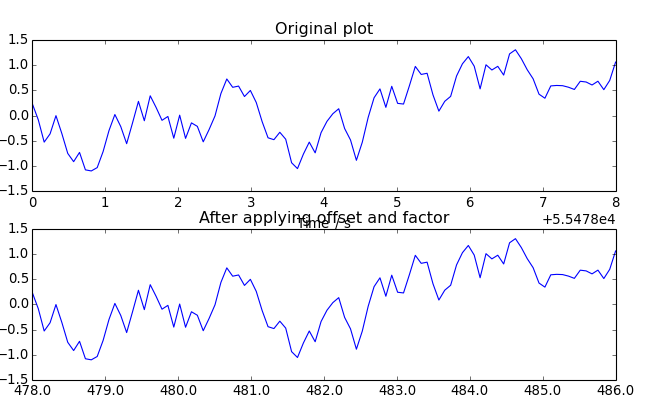
- modelicares.util.shift_scale_x(ax, eagerness=0.325)
If helpful, apply an offset and a factor to the x axis.
Arguments:
ax: Axes (matplotlib.axes.Axes object)
eagerness: Parameter to adjust how little of an offset is allowed before the label will be recentered
- 0: Offset is never applied.
- 1: Offset is always applied if it will help.
Example:
(Source code, png, hires.png, pdf)
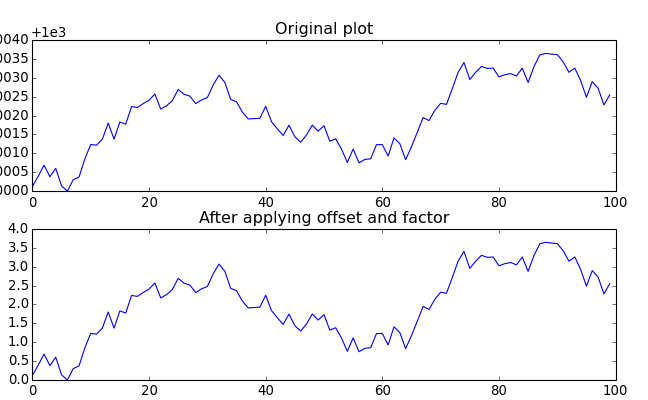
- modelicares.util.shift_scale_y(ax, eagerness=0.325)
If helpful, apply an offset and a factor to the y axis.
Arguments:
ax: Axes (matplotlib.axes.Axes object)
eagerness: Parameter to adjust how little of an offset is allowed before the label will be recentered
- 0: Offset is never applied.
- 1: Offset is always applied if it will help.
Example:
(Source code, png, hires.png, pdf)
- modelicares.util.si_prefix(pow1000)
Return the SI prefix for a power of 1000.
- modelicares.util.tree(strings, separator='.', container=<type 'dict'>)
Return a tree of strings as a nested dictionary.
The levels of hierarchy in each string are marked with separator. The keys in the dictionary are the sub-branch names. The value at the end of each branch is the full string.
Arguments:
strings: List of strings
separator: String that marks a level of hierarchy
container: Dictionary-like class used for the results
To keep the order of the list for the tree, use collections.OrderedDict.
Example:
>>> tree(['a.b.c', 'd.e', 'd.f'])
{'a': {'b': {'c': 'a.b.c'}}, 'd': {'e': 'd.e', 'f': 'd.f'}}
- modelicares.util.yes(question)
Ask a yes/no question and return True if the answer is ‘Y’ or ‘y’.
Arguments:
- question: String representing the question to the user
Example:
>>> if yes("Do you want to print hello (y/n)?"):
...     print("hello")
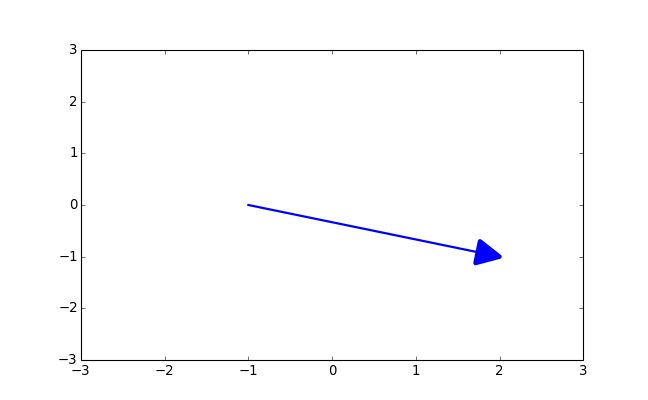
- class modelicares.util.ArrowLine(*args, **kwargs)
A matplotlib subclass to draw an arrowhead on a line
Arguments:
- arrow (=’-‘): Type of arrow (‘<’ | ‘-‘ | ‘>’)
- arrowsize (=2*4): Size of arrow
- arrowedgecolor (=’b’): Color of arrow edge
- arrowfacecolor (=’b’): Color of arrow face
- arrowedgewidth (=4): Width of arrow edge
- arrowheadwidth (=arrowsize): Width of arrow head
- arrowheadlength (=arrowsize): Length of arrow head
- *args, **kwargs: Additional arguments for matplotlib.lines.Line2D
Example:
(Source code, png, hires.png, pdf)
![]()
Project Info
Modules and Scripts
- loadres script
- modelicares
- modelicares.exps
- modelicares.exps.doe
- modelicares.linres
- modelicares.simres
- modelicares.util